What Is Show Your Stripes Day?

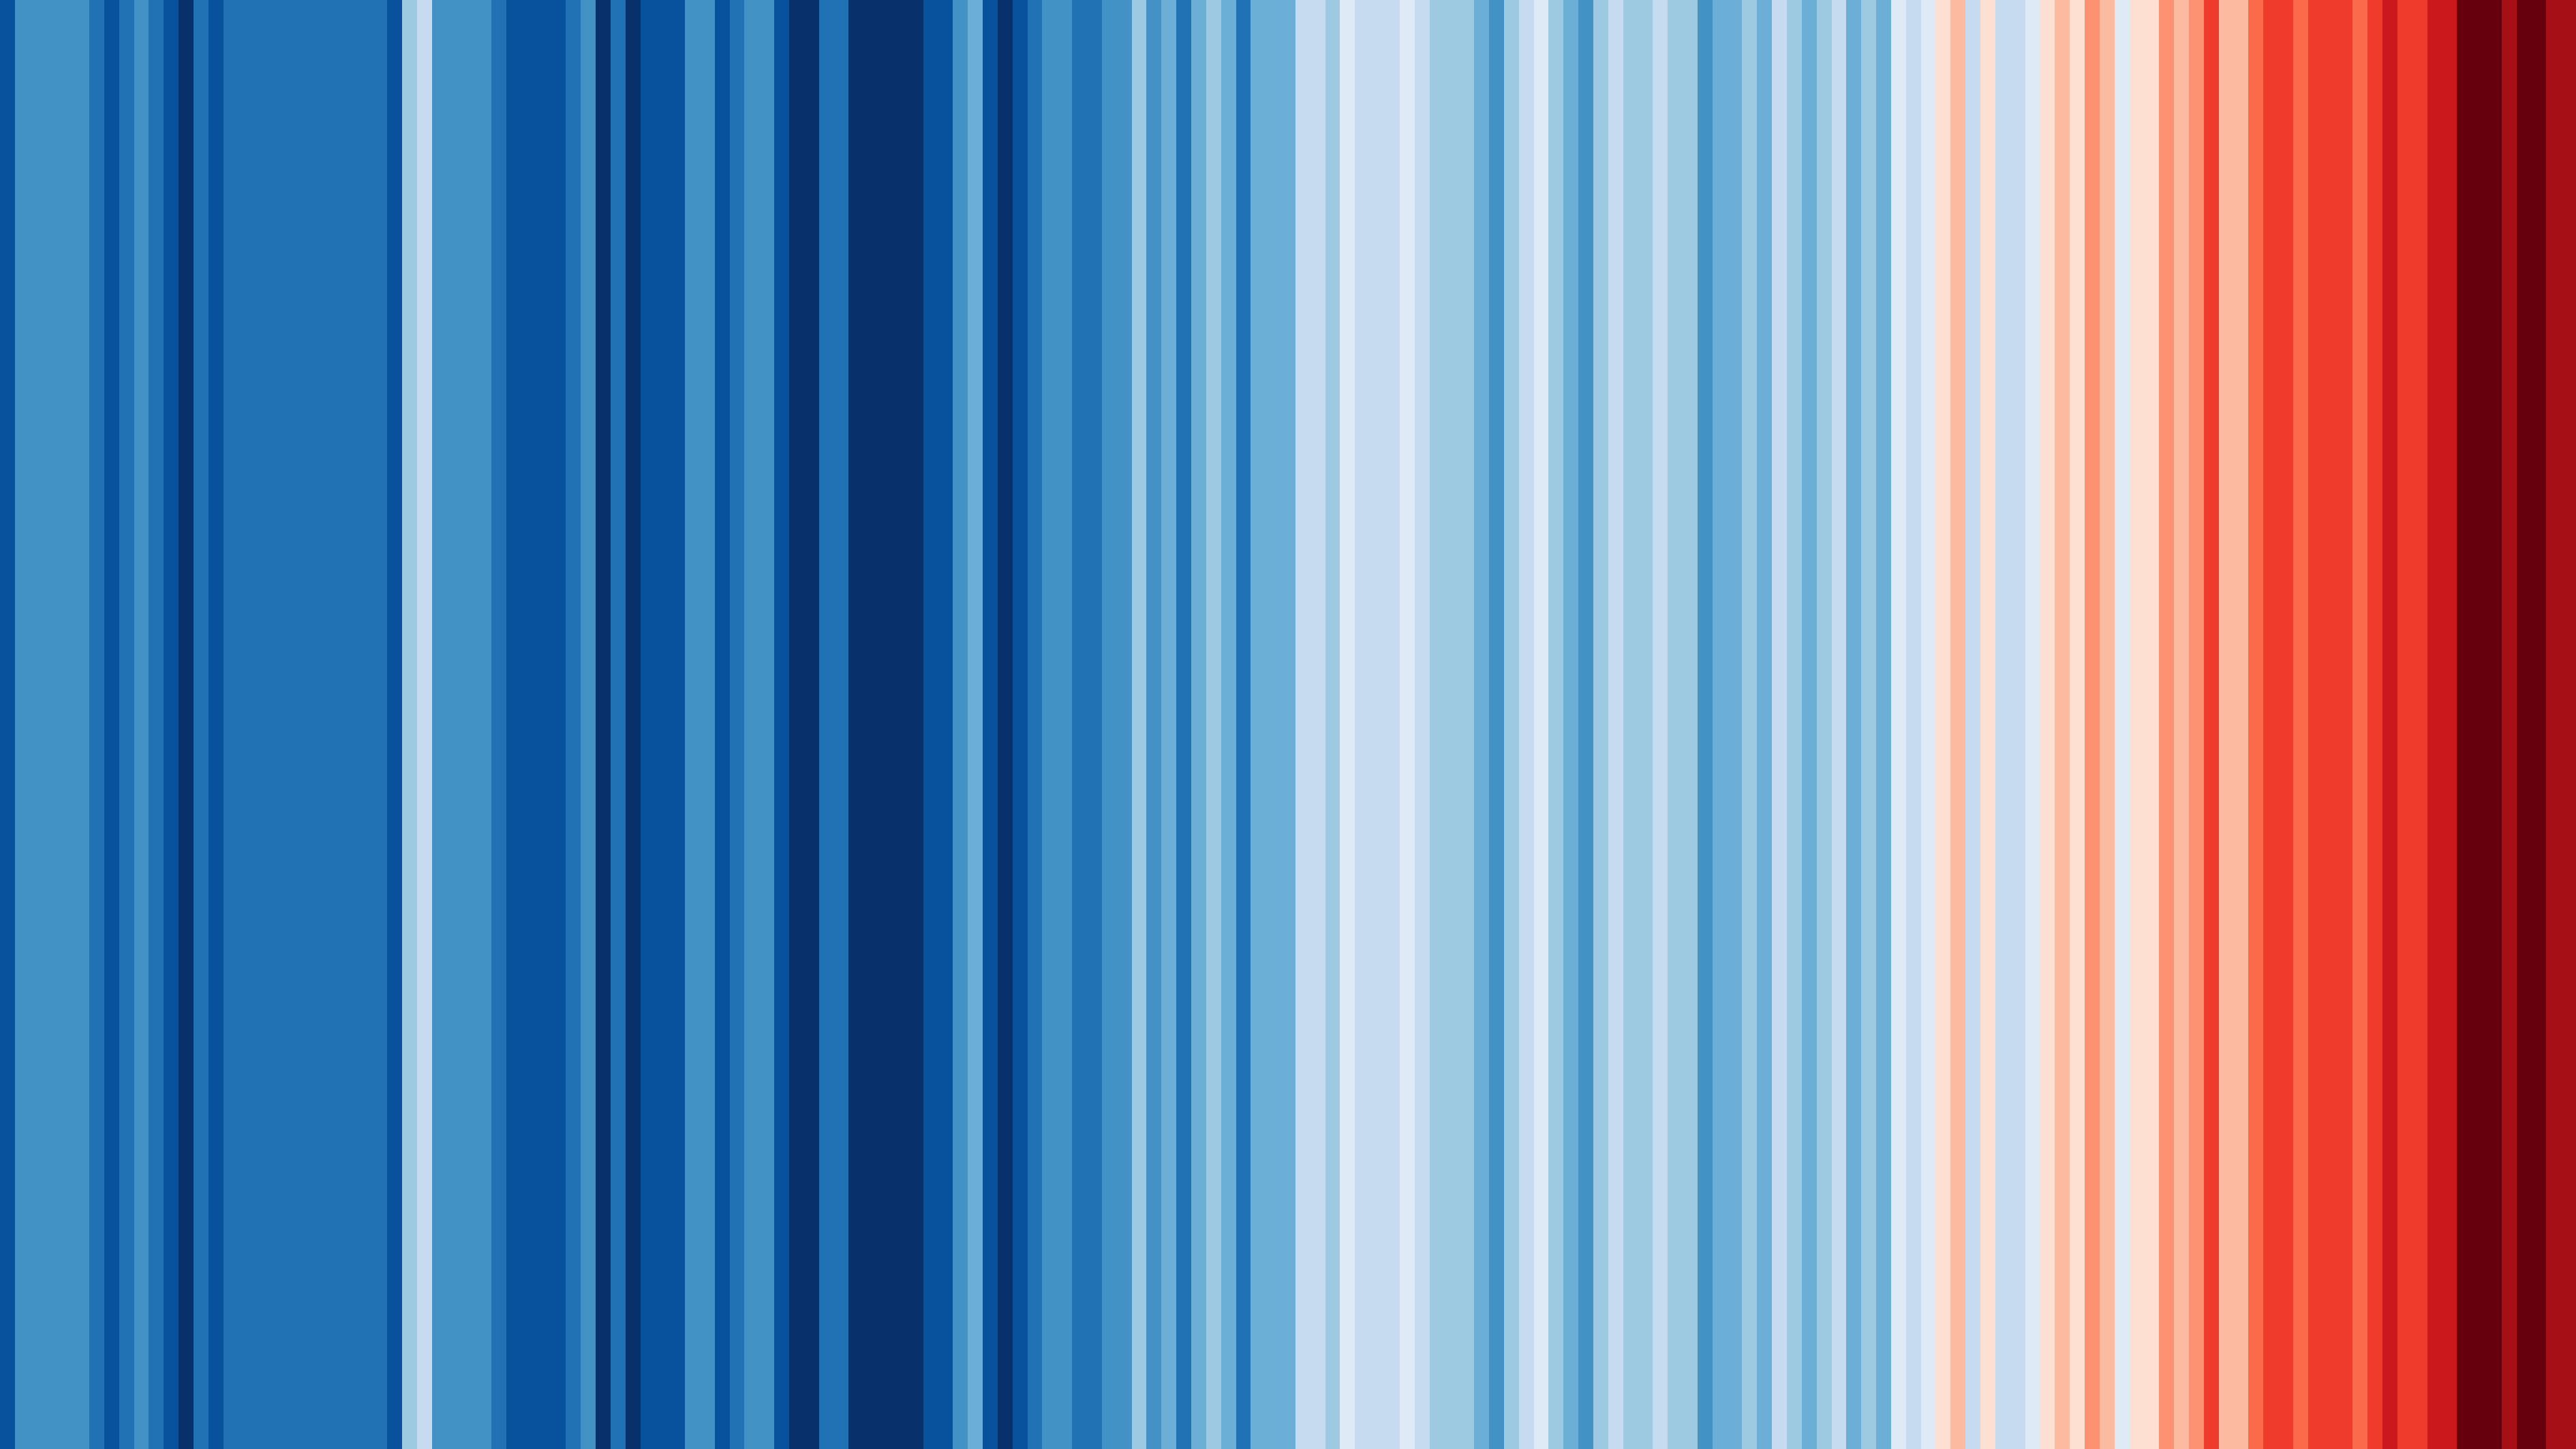
Show Your Stripes Day is an annual event held on June 21st. Prof. Ed Hawkins at the University of Reading came up with this project. Its goal is to make people more aware of climate change by using vertical coloured bars to show how the Earth is slowly warming up in one picture.
The official website for the Show Your Stripes campaign provides two data views, one with labels and the other without, to help visualize the massive impact that climate change is having. Rather than overwhelming viewers with technical terms and complex data, the sparse graphics are meant to support conversations.
Countries, regions, and cities will be represented by stripes that range from blue to red, showcasing the rise in average temperatures in that area. Blue shows a year that is cooler than usual, while red shows a year that is warmer than usual. The swift transition to dark shades of red conveys a clear signal that our climate is undergoing a rapid warming at an unprecedented rate.
Since the stripes were developed in 2018, they have been utilised extensively throughout the world to convey the rapid rise in global temperatures that has been occurring in recent decades, and to demonstrate the rapid pace of change visually.
Using the official website, people can download stripes for the world, continent, country, and region illustrating the average annual rise in temperature where they live. The graphics which have a CC-BY4.0 licence (can be used for any purpose as long as credit is given to Professor Ed Hawkins (University of Reading) and a link is provided to the website) can accompany #ShowYourStripes on social media and start discussions prompting action.
Although data may vary based on the country, the majority of countries date back to 1901, while the UK, the US, Switzerland, Germany, and the cities of Stockholm and Vienna go back further. The data comes from Berkeley Earth, the UK Met Office's HadCRUT5.0 data set, and some countries national meteorological agencies.
Carbon Copy has an interactive map of the UK with regions coloured a shade of green, grey, or black depending on their net-zero targets. Selecting a region also shows the stripes for the particular county, such as Cornwall. The site also lists the population, CO2 equivalent, average CO2 per person and more.
If you have read the entire article, I hope you enjoyed what I wrote. If you did, please share this article with someone who would appreciate it too.


